
Sale


The Demand and Supply Diagram MT4 is a market analysis tool that visually represents supply and demand dynamics. It identifies potential trend reversals by highlighting areas of excess demand and supply. The indicator generates signals like “Buy point” or “Sell point,” enhancing trading decisions with alerts and tips while analyzing price elasticity and volume.
Advantages of Demand and Supply Diagram MT4
The Demand and Supply Diagram for MT4 provides traders with a robust tool for market analysis by clearly illustrating the balance between supply and demand. Here are some key advantages:
1. Enhanced Trading Efficiency
The diagram allows traders to identify potential trend reversals before they happen. By visualizing where supply is exhausted and demand begins, traders can enter trades with increased confidence, minimizing losses and maximizing potential profits.
2. Clear Signal Indicators
With various signal types such as Excess Demand (ED), Excess Supply (ES), No Demand (ND), and No Supply (NS), traders receive clear, actionable insights. The accompanying warning messages like “Sell area” and “Buy area” further guide trading decisions, making it easier to make informed choices.
3. Customizable Input Variables
The MT4 diagram comes with multiple input variables that allow users to tailor the indicator according to their trading preferences and strategies. Options for alerts, trading tips, and visual display settings enhance user experience and facilitate personalized analysis.
4. Comprehensive Market View
By taking into account price and volume data, traders can gain a deeper understanding of market dynamics. The flexibility to view historic diagrams and signals aids in recognizing patterns that may influence future trades.
5. Real-time Monitoring
The constant recalculation of the diagram ensures that traders have up-to-date information on supply and demand. This real-time aspect is crucial for making timely trades that adapt to changing market conditions.
6. Clear Trade Confirmation
The “Buy point” and “Sell point” messages provide explicit confirmation signals. The combination of these messages along with visual cues, such as flashing price tags, makes it easy for traders to recognize and act on potential opportunities quickly.
7. Flexibility in Analysis
With options to analyze different volume types and adjust profiling settings, traders can conduct a more thorough examination of market conditions. Whether using cumulative volumes or specific profiles, the diagram supports innovative trading strategies.
8. Additional Filters for Precision
The ability to filter signals based on elasticity and subsequent chains enhances the accuracy of the predictions made by the indicator. This helps reduce false signals and improve overall trade quality.
In conclusion, the Demand and Supply Diagram for MT4 is a powerful tool that combines simplicity with advanced analytical capabilities, making it an invaluable asset for traders aiming to enhance their trading performance.
![]()
The Viper EA MT4
Original price was: $149.$29Current price is: $29.
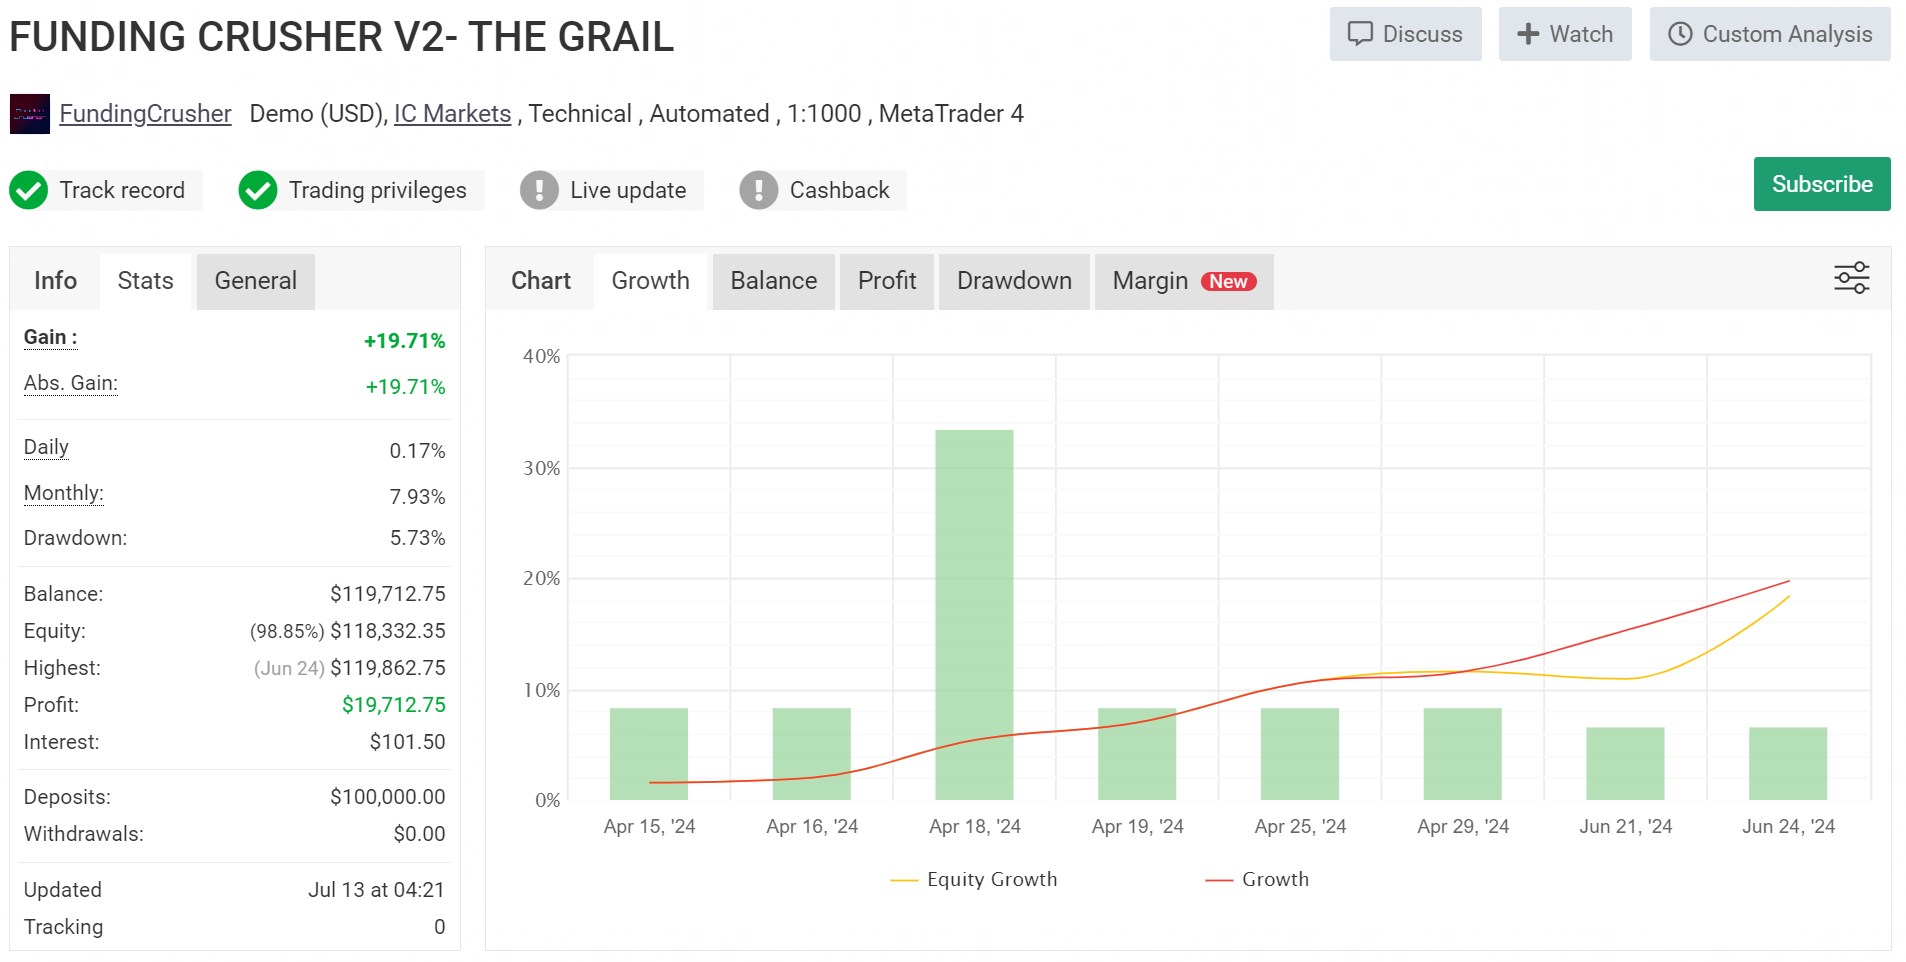
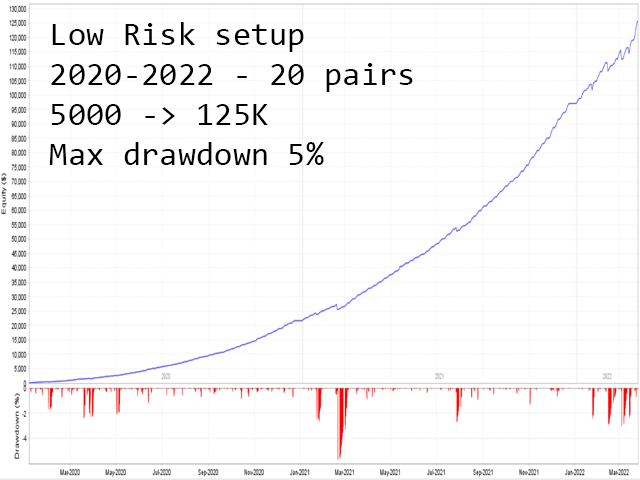
The Grail Funding Crusher EA MT4 and MT5
Original price was: $2,000.$29Current price is: $29.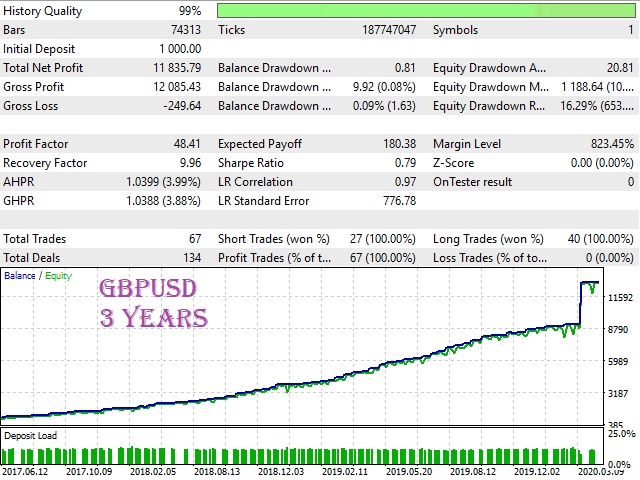
Good Monday EA MT4
Original price was: $190.$29Current price is: $29.

AlgoScalpPro EA MT4
Original price was: $349.$29Current price is: $29.
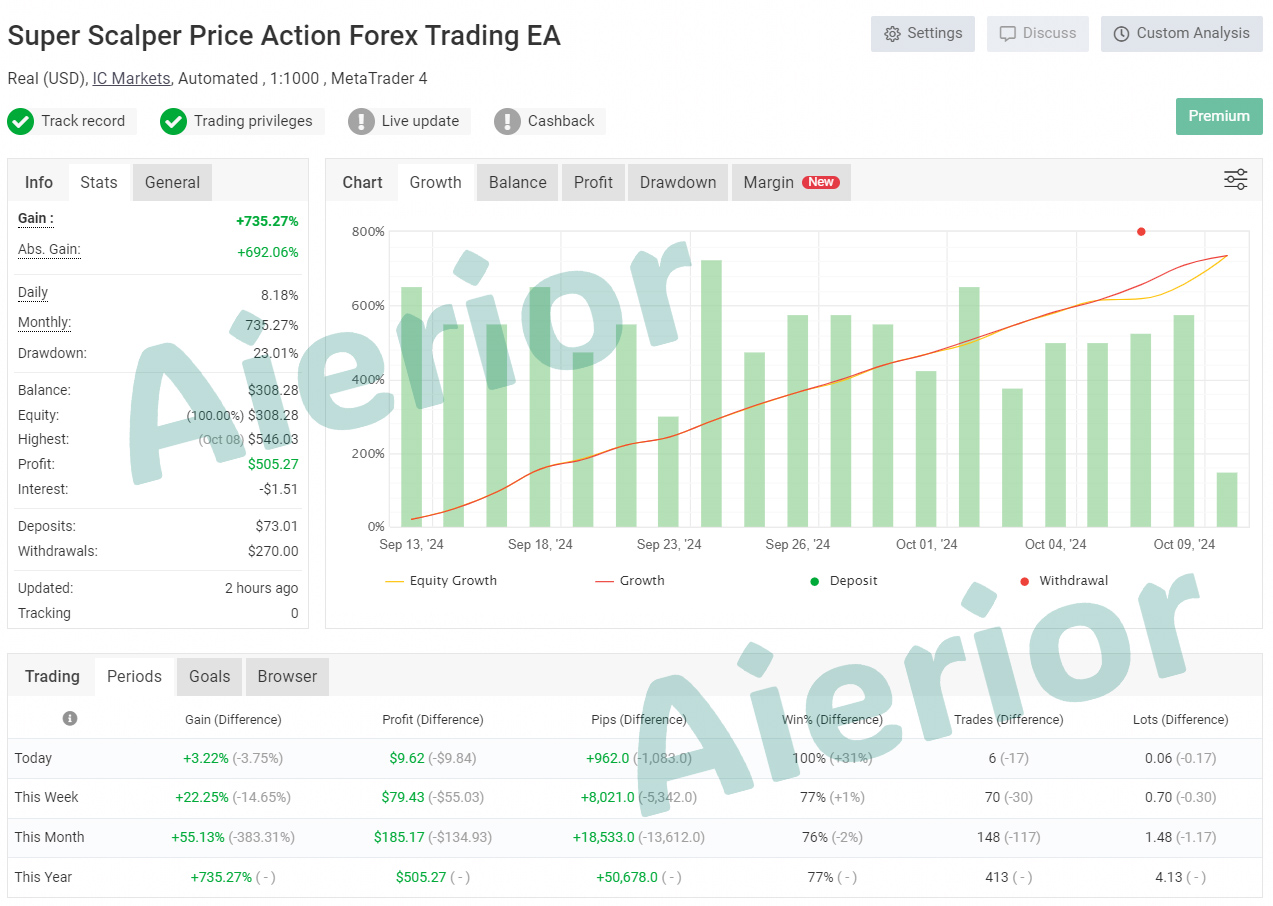
Super Scalper Price Action Forex Trading Robot EA MT5
Original price was: $1,599.$199Current price is: $199.
Alpha Striker us30 EA MT4
Original price was: $500.$29Current price is: $29.
Stargogs Pay EA MT5
Original price was: $110.$29Current price is: $29.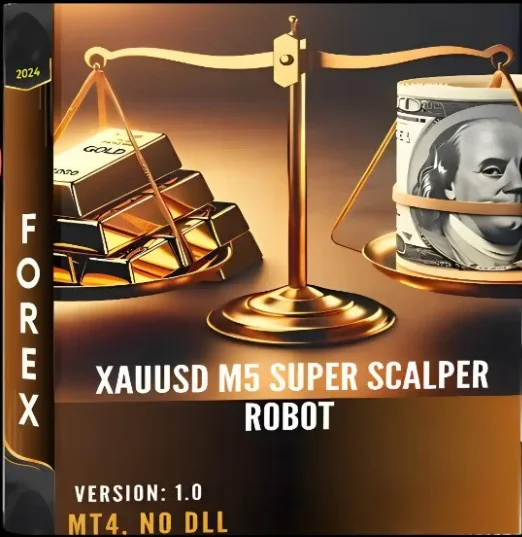
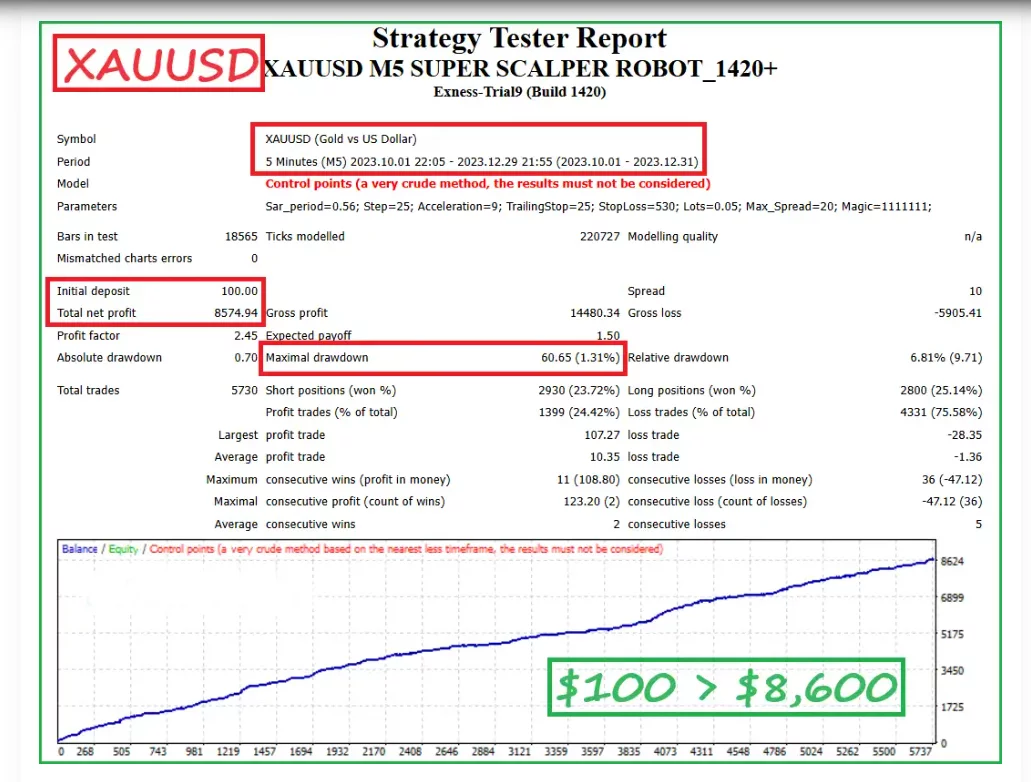
XAUUSD M5 SUPER SCALPER ROBOT
Original price was: $799.$29Current price is: $29.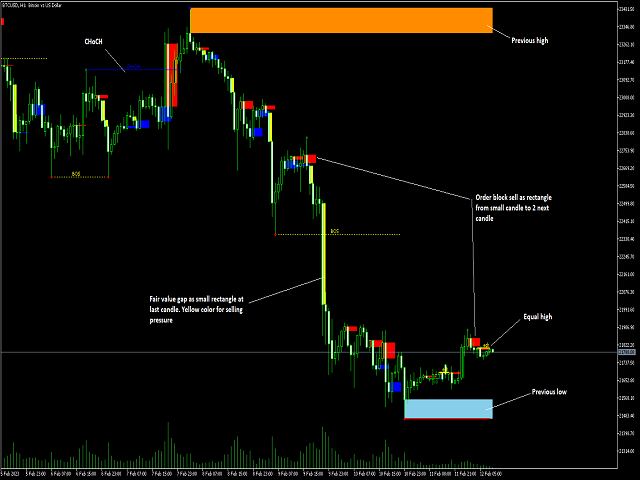
Smart Market Structure Concept version MT4
Original price was: $50.$29Current price is: $29.
Albatross ver4 EA MT4
Original price was: $3,600.$29Current price is: $29.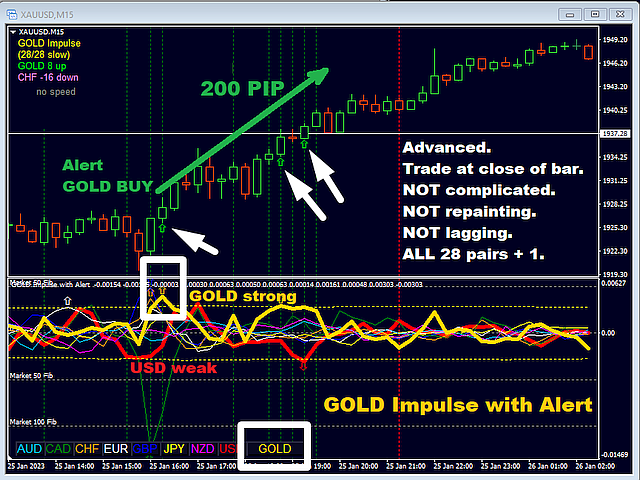
GOLD Impulse with Alert MT4
Original price was: $149.$29Current price is: $29.
Dashboard Super Currency Strength Advanced MT4
Original price was: $150.$29Current price is: $29.Original price was: $35.$29Current price is: $29.
Reviews
There are no reviews yet.