
Sale


Easy Technical MT4 is a robust trading indicator that identifies market trends and their strength. It features a histogram that indicates bullish or bearish conditions and a signal line that simplifies volatility. Users receive clear buy/sell signals and can adjust settings to optimize performance, aiding effective trading decisions.
Advantages of Easy Technical MT4
The Easy Technical Indicator is designed to empower traders by providing reliable insights into market trends and their strengths. Here are some of the key advantages:
1. Accurate Trend Detection
The Easy Technical Indicator excels in identifying the main market trends, allowing traders to make informed decisions. Its ability to showcase whether the market is bullish or bearish improves trading accuracy.
2. Reliable Buy and Sell Signals
The integrated Signal Line minimizes market volatility, transforming primary trends into dependable buy or sell signals. This feature is crucial for traders who need clear entry and exit points.
3. Trend Strength Visualization
The Histogram provides a visual representation of market trends, where:
- A histogram above zero indicates a bullish market.
- A histogram below zero signifies a bearish market.
- The height of the histogram bars reflects the strength of the trend.
- Traders can easily identify when the market is overbought or oversold based on histogram values reaching 100 or -100.
- When the histogram equals zero, it signals a neutral market.
4. Reduced Noise from Minor Corrections
The function of the Signal Line is to filter out noise from minor corrections and neutral trends. By concentrating on significant market movements, it enables traders to focus on what truly matters:
- Crossing from below zero to above indicates a buy signal.
- Crossing from above zero to below indicates a sell signal.
- Traders have the flexibility to adjust the period of the Signal Line in the settings panel as needed.
5. Comprehensive Use of Indicators
Easy Technical MT4 employs a variety of indicators, including:
- Multiple moving averages with different periods and methods
- Ichimoku base line (Kijun-sen)
- MACD
- ADX
- Momentum
- CCI
- William’s Percent range
- Stochastic
- Envelopes
- DeMarker
- Awesome
With these multiple indicators, traders can gain a deeper understanding of market dynamics, enhancing their trading strategies.
Contact me in messages for a free gift after purchase!
![]()
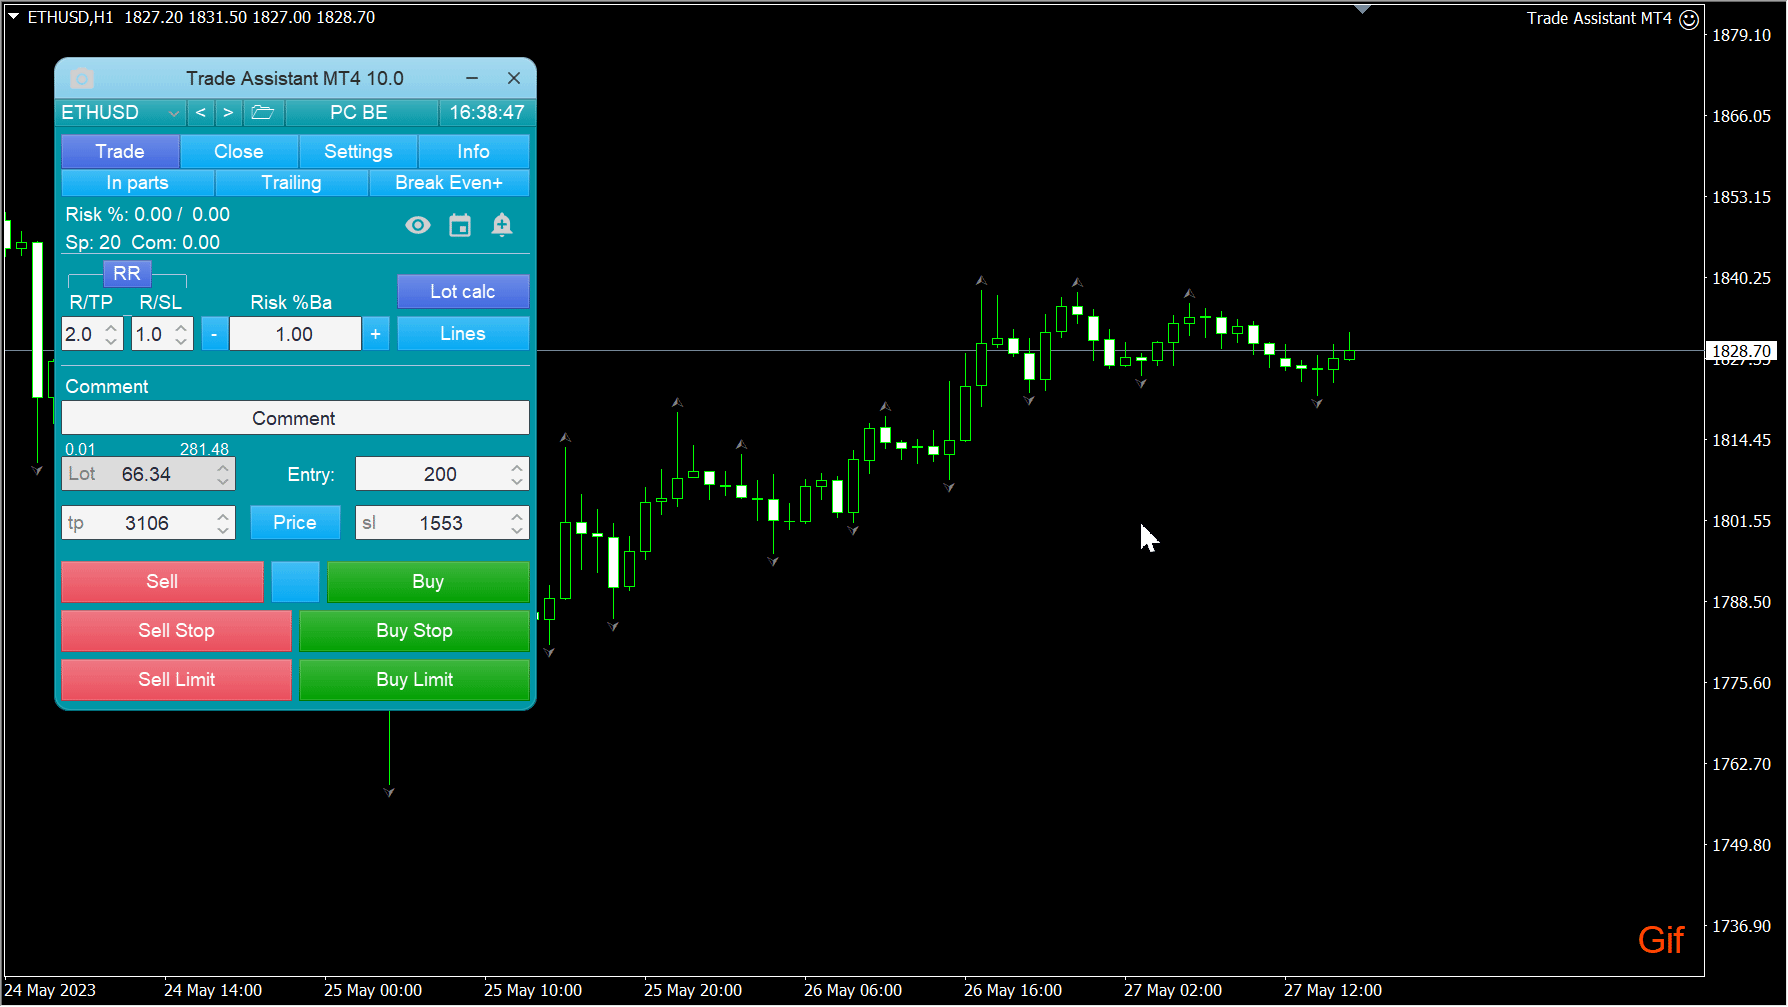
Trade Assistant MT4
Original price was: $100.$29Current price is: $29.
Algo Bot EA MT5
Original price was: $30.$29Current price is: $29.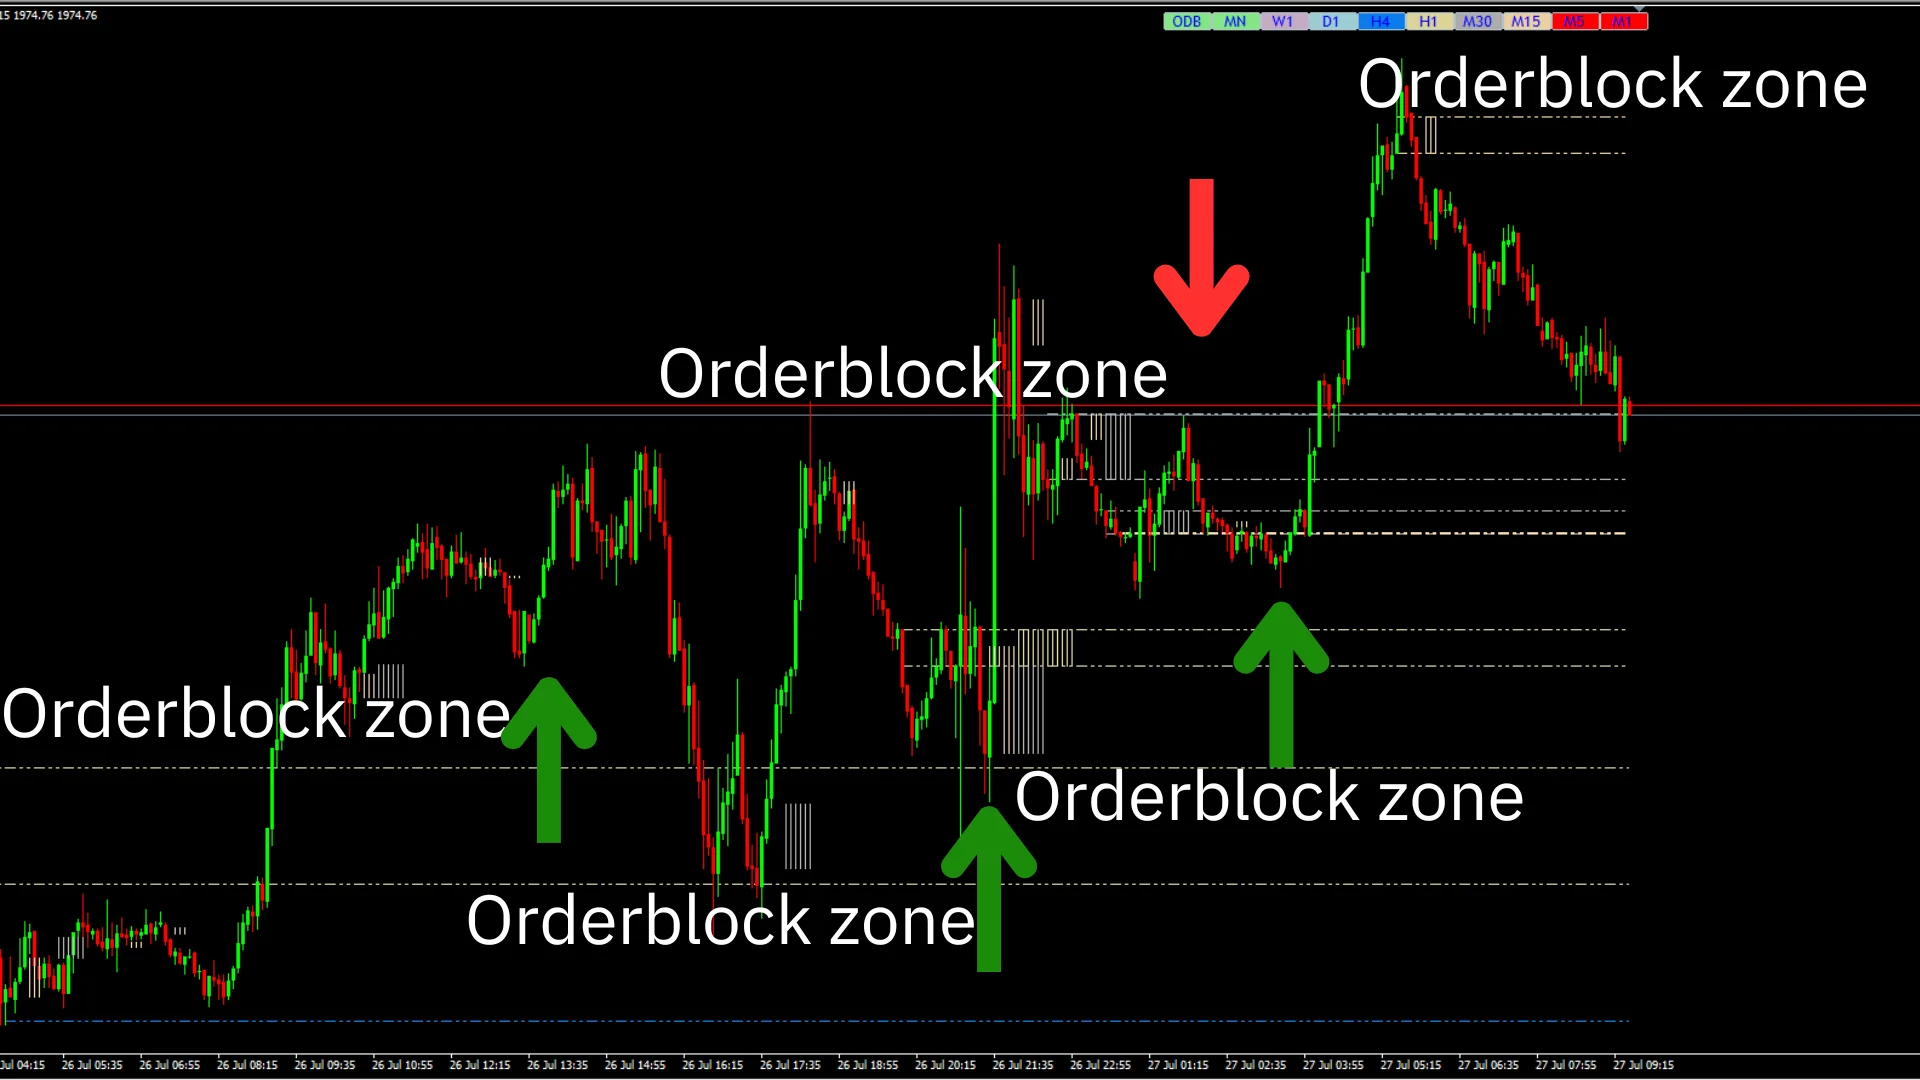
OrderBlock MT5
Original price was: $119.$29Current price is: $29.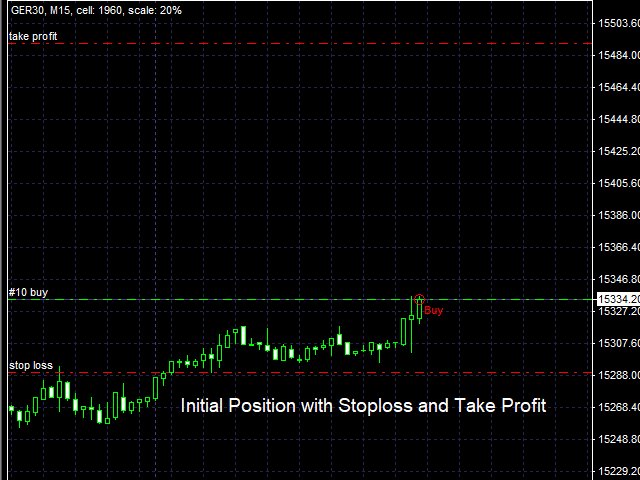
Riskless Pyramid MT4
Original price was: $100.$29Current price is: $29.
Renko Scalping EA MT4
Original price was: $60.$29Current price is: $29.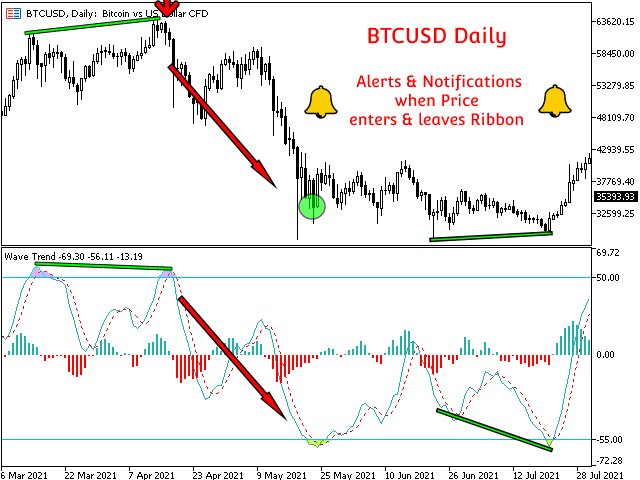
Wave Trend MT5
Original price was: $129.$29Current price is: $29.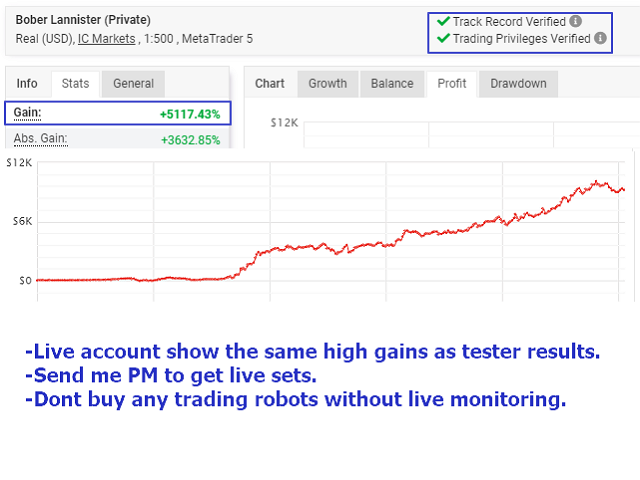
Bober Lannister EA MT4
Original price was: $900.$29Current price is: $29.
Night Hunter Pro EA MT4
Original price was: $2,600.$29Current price is: $29.
Benefit EA MT4
Original price was: $10,000.$29Current price is: $29.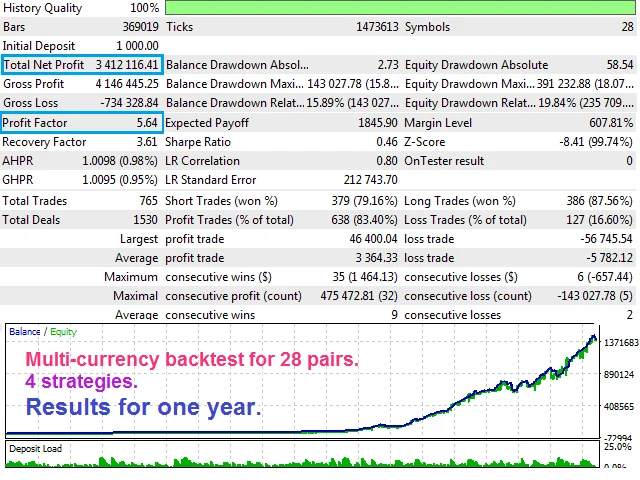
Arbitrage Mixed EA MT4
Original price was: $70.$29Current price is: $29.BenderFX EA MT4
Original price was: $139.$29Current price is: $29.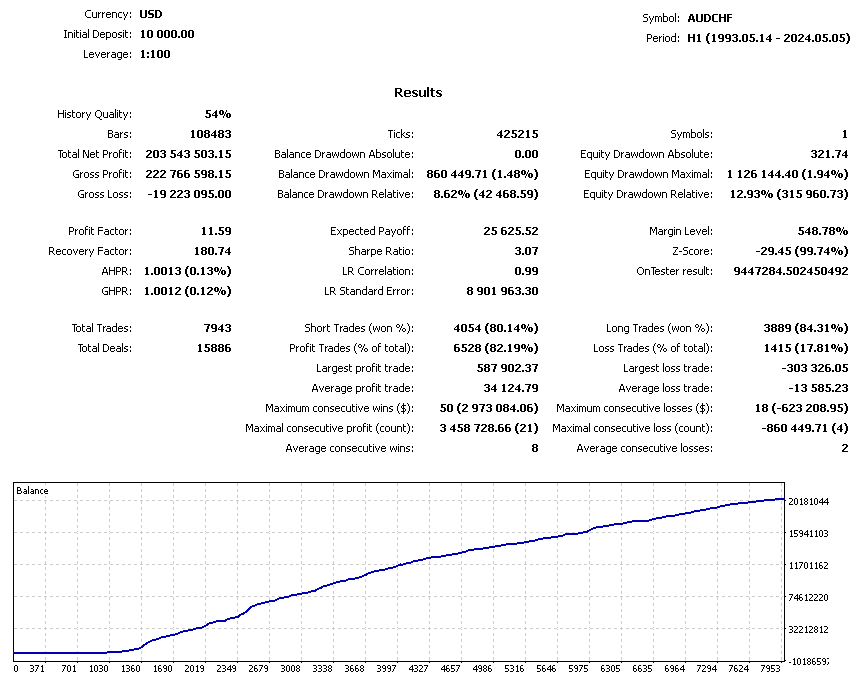
Richter EA MT4
Original price was: $1,111.$29Current price is: $29.Original price was: $30.$29Current price is: $29.
Reviews
There are no reviews yet.