
Sale


The Market Statistics Dashboard for MT4 is a powerful statistical analysis tool that evaluates market data based on historical performance across different timeframes, including monthly, weekly, and daily charts. It identifies trading signals by analyzing the confluence of these timeframes, ensuring accurate insights for traders.
Advantages of Market Statistics Dashboard MT4
The Market Statistic Dashboard for MT4 is an invaluable tool for traders seeking to enhance their market analysis through comprehensive statistical insights. Here are some of the key advantages:
1. In-Depth Statistical Analysis
This dashboard provides a rigorous statistical analysis of market movements by scanning historical data. By comparing monthly charts and analyzing trends across various timeframes, traders receive accurate insights that help inform their trading strategies.
2. Multi-Timeframe Analysis
By examining weekly, daily, and monthly charts, the Market Statistics Dashboard allows traders to observe market behavior over different periods. This multi-timeframe approach facilitates a better understanding of price action and helps identify potential trading opportunities with higher confidence.
3. Higher Statistical Certainty
One of the standout features of this tool is its requirement for the confluence of multiple timeframes. By waiting for all timeframes to align, traders can achieve a greater level of statistical certainty regarding trading signals, thereby minimizing the risk of false signals.
4. Customizable Inputs
The dashboard is highly customizable, allowing users to set the symbols they wish to analyze, configure time frame settings, and select the years of historical data to evaluate. This level of customization helps tailor the analysis to specific trading strategies and preferences.
5. Alert System
With an integrated alert system, users are notified when all timeframes indicate the same trading direction, enhancing decision-making efficiency. This feature ensures that traders do not miss critical trading opportunities.
6. Visual and User-Friendly Interface
The dashboard offers flexible options for graphical representation, allowing traders to set color-coded signals based on statistical results. Users can customize the dashboard’s appearance according to their preferences, making it more intuitive and accessible for different trading styles.
7. Refreshing Historical Data
The tool emphasizes the importance of refreshing the history center for more reliable statistical data. This feature ensures that traders are working with the most current and accurate information when making decisions.
Conclusion
In conclusion, the Market Statistics Dashboard for MT4 is a powerful tool that provides traders with in-depth analysis, multiple timeframe comparisons, and customizable options. By leveraging this dashboard, traders can enhance their analytical capabilities and make more informed trading decisions.
![]()

Bitcoin Robot EA MT4
Original price was: $1,099.$29Current price is: $29.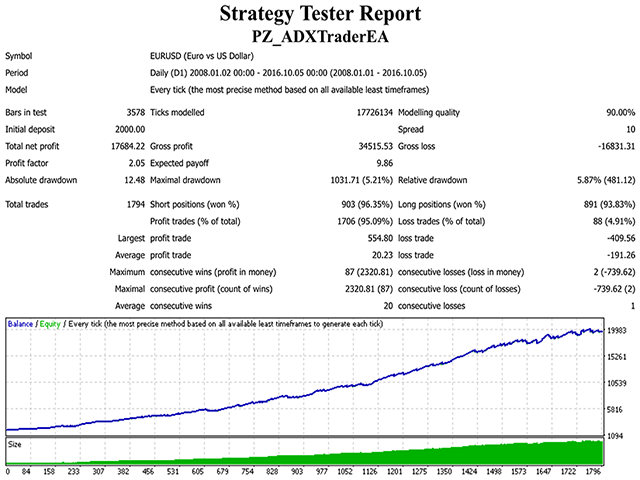
PZ ADX Trader EA MT4
Original price was: $30.$29Current price is: $29.
AbuTrader EA MT4
Original price was: $300.$29Current price is: $29.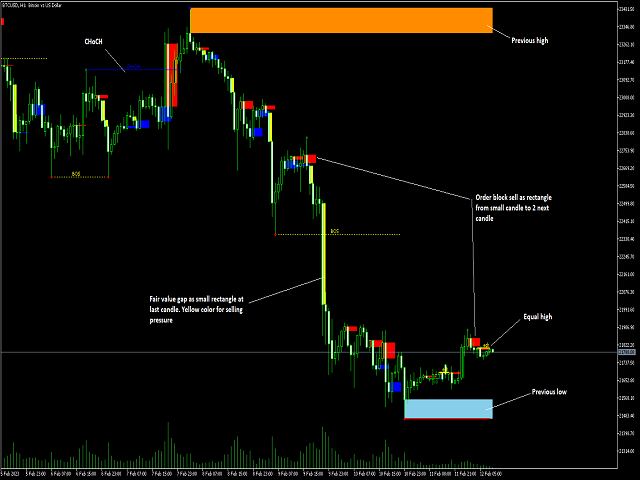
Smart Market Structure Concept version MT4
Original price was: $50.$29Current price is: $29.
Diamond Titan FX EA MT4
Original price was: $753.$29Current price is: $29.
ForexScalpEA EA MT5
Original price was: $399.$299Current price is: $299.
Gap Trading Robot EA MT4
Original price was: $30.$29Current price is: $29.
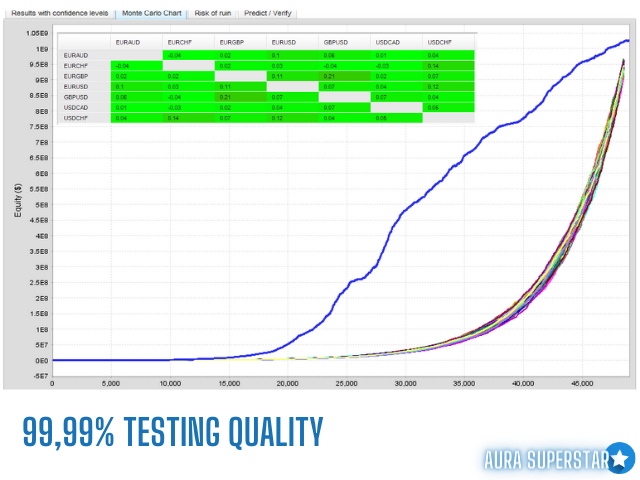
Aura Superstar EA MT4
Original price was: $499.$29Current price is: $29.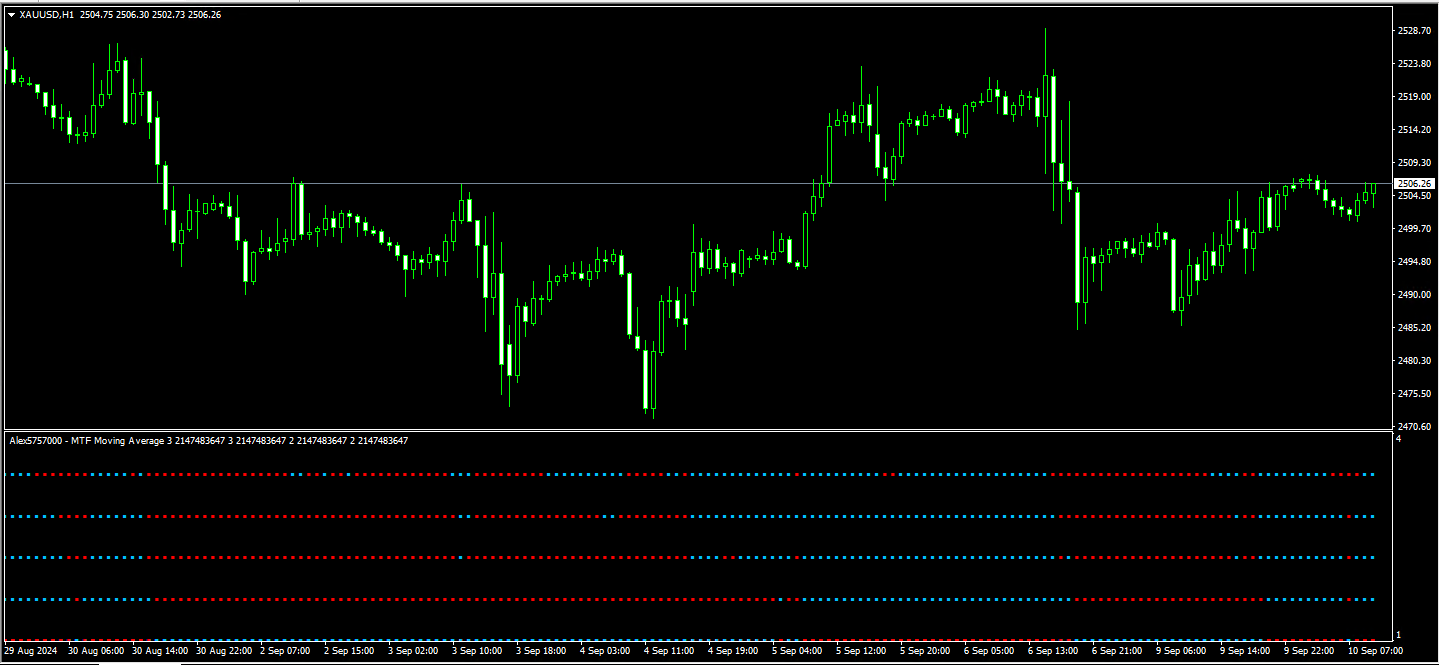
Best Multi Moving Average MT4
Original price was: $149.$29Current price is: $29.
CAP Zone Recovery Builder EA MT4
Original price was: $69.$29Current price is: $29.
Big Forex Players EA MT4
Original price was: $1,599.$29Current price is: $29.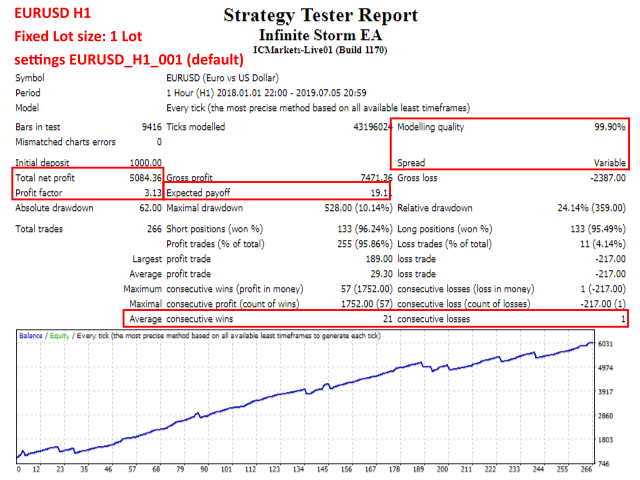
Infinite Storm EA MT4
Original price was: $225.$29Current price is: $29.Original price was: $100.$29Current price is: $29.
Reviews
There are no reviews yet.