
Sale


The PZ Volatmeter MT4 is a multi-timeframe volatility indicator designed to identify flat markets, volatility spikes, and price cycles. It features a green histogram for current volatility, blue and orange lines for short-term volatility, and a red line for higher timeframe trends. The tool aids traders in recognizing optimal volatility conditions for trading.
Advantages of PZ Volatmeter MT4
The PZ Volatmeter MT4 is a powerful trading indicator designed to help traders effectively navigate the complexities of market volatility. Below are some key advantages of using this indicator:
- Multi-timeframe Analysis: This indicator measures volatility across multiple timeframes, providing a comprehensive view of the market. This allows traders to identify flat markets, volatility spikes, and price movement cycles with ease.
- Trading with Volatility: The PZ Volatmeter enables traders to enter positions when volatility is favorable, ensuring that trades are made in conditions that align with market movements. This can lead to more profitable trading outcomes.
- Spotting Short-term Volatility: Traders can quickly identify short-term volatility and price spikes, making it easier to capitalize on rapid market movements. This is essential for those who engage in scalping or day trading strategies.
- Clear Volatility Cycles: The indicator provides a clear visual representation of volatility cycles, helping traders to understand and anticipate market behavior. The red line corresponds to higher timeframe volatility, giving a broader perspective of volatility trends.
- Non-repainting Indicator: One of the standout features of the PZ Volatmeter is that it is non-repainting, meaning that the signals generated are reliable and remain consistent over time. This reduces the risk of being misled by false signals as the market evolves.
How to Interpret the Indicator
The PZ Volatmeter MT4 comprises various components that inform trading decisions:
- The green histogram represents the current bar’s volatility, providing immediate insight into market activity.
- The blue line indicates fast volatility, while the orange line reflects slow volatility. Monitoring these lines helps assess short and longer-term volatility trends.
- The red line shows the higher timeframe volatility, allowing traders to zoom out and view volatility cycles more holistically.
Key Trading Implications
- If the green histogram exceeds the two lines, it signals extreme short-term volatility.
- When the blue line is above the orange line, it indicates a generally high volatility environment.
- If the orange line is above the red line, it suggests elevated market volatility, which could be advantageous for potential trades.
Conclusion
The PZ Volatmeter MT4 is an invaluable tool for traders seeking to harness market volatility to their advantage. With its ability to deliver multi-timeframe volatility analysis, clear signals, and reliable performance, it stands out as a must-have for serious traders.
Author: Arturo López Pérez, a private investor and speculator, software engineer, and founder of Point Zero Trading Solutions.
For more information on installation and usage, you can refer to the following resources:
![]()


AlgoScalpPro EA MT4
Original price was: $349.$29Current price is: $29.
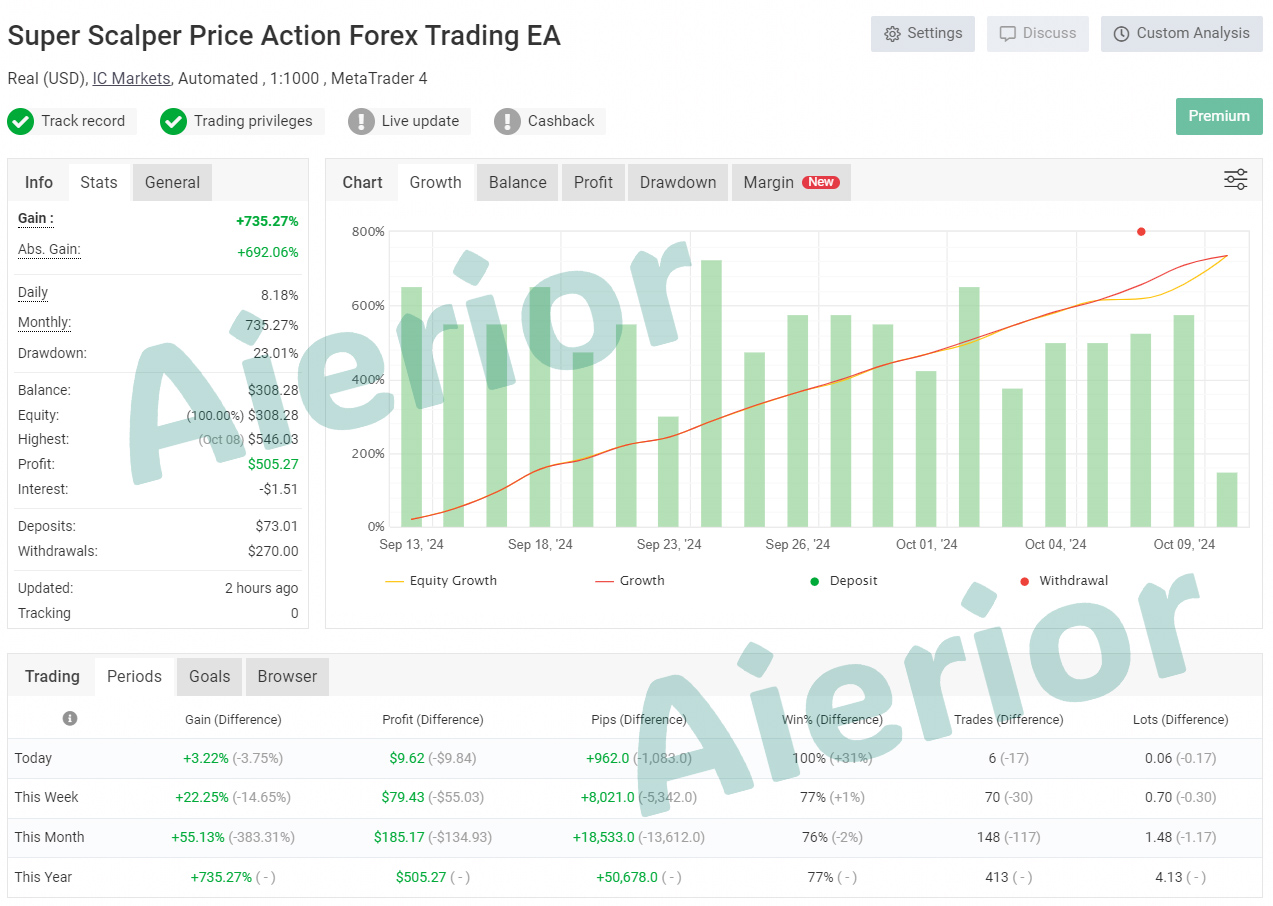
Super Scalper Price Action Forex Trading Robot EA MT5 White Label Solution
Original price was: $159,999.$4,999Current price is: $4,999.
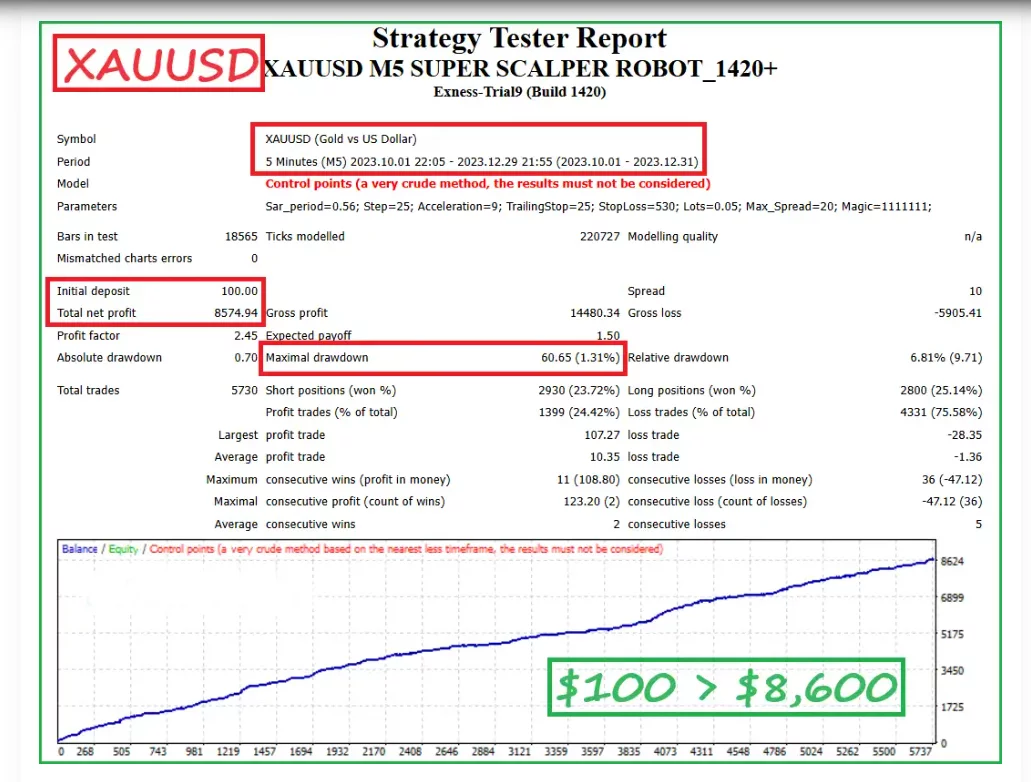
XAUUSD M5 SUPER SCALPER ROBOT
Original price was: $799.$29Current price is: $29.
Don Hits EA MT4
Original price was: $799.$29Current price is: $29.
Luna AI PRO EA MT4
Original price was: $399.$29Current price is: $29.
R Factor EA MT4
Original price was: $999.$29Current price is: $29.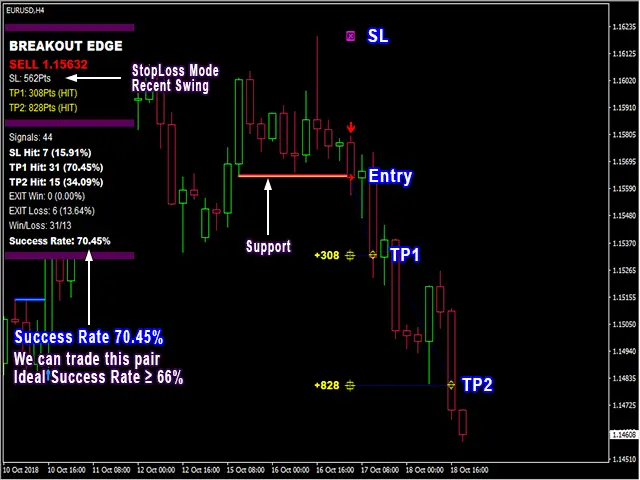
PipFinite Breakout EDGE MT4
Original price was: $98.$29Current price is: $29.
Bitcoin Robot EA MT4
Original price was: $1,099.$29Current price is: $29.
Alpha Striker Smc King V3 EA MT4
Original price was: $500.$29Current price is: $29.
Super Scalper Price Action Forex Trading Robot EA MT5
Original price was: $1,599.$199Current price is: $199.
Yarukami Mnukakashi EA MT5
Original price was: $360.$29Current price is: $29.
Indicement EA MT4
Original price was: $399.$29Current price is: $29.Original price was: $30.$29Current price is: $29.
Reviews
There are no reviews yet.