
Sale


The Scanner and Dashboard for Money Flow Index (MFI) on MT4 is a tool that identifies overbought/oversold conditions and signals trend changes using price and volume data. It offers customizable alerts, supports multiple timeframes, and works with various instruments. Features include visual signals for buy/sell actions and divergence detection.
Advantages of the Scanner and Dashboard for MFI MT4
The Scanner and Dashboard for Money Flow Index (MFI) in MT4 provides a powerful toolkit for traders looking to integrate price and volume data into their trading strategies. Here are some of its key advantages:
1. Full Alert Options
The scanner allows traders to set up comprehensive alert options. Whether you are using desktop or mobile, you ensure that you are promptly notified about potential trading opportunities, enabling you to make informed decisions swiftly.
2. Multi-Timeframe Capability
With the ability to analyze multiple timeframes (from M1 to MN1), traders can adapt their strategies depending on their trading style, whether it be scalping, day trading, or long-term investing.
3. Versatility Across Instruments
The scanner is designed to work seamlessly across all asset classes, including Currencies, Indices, Commodities, Cryptocurrencies, and Stocks. This broad compatibility allows traders to apply the MFI strategy across different markets without needing additional tools.
4. Customizable Display Options
Users can fully customize display options based on their trading preferences, making it easier to interpret signals at a glance. This personalization enhances usability and efficiency, particularly during high-volatility periods.
5. User-Defined Levels
Traders can set their own levels for overbought and oversold indicators, allowing for a tailored approach that aligns with their specific trading strategies or market situations.
6. Enhanced Signal Identification
The dashboard clearly displays three critical types of trading signals:
– Breakouts of the median line (BUY/SELL signals)
– Overbought or oversold levels (OB/OS signals)
– Reversal signals (BUY R/SELL R)
This clear categorization aids in making precise trading decisions quickly.
7. Divergence Detection
One of the significant advantages of the MFI is its ability to identify divergences between price action and the indicator. This feature serves as a critical warning of potential trend changes, allowing traders to capitalize on emerging opportunities.
8. Historical Data Analysis
With a user-defined number of look-back bars, traders can analyze past signals to determine effectiveness and refine their trading strategies based on empirical data.
9. Template Application
The ability to apply a predefined template directly from the dashboard increases efficiency by enabling quick analysis of the corresponding chart, facilitating immediate decision-making.
10. Additional Support
Upon purchasing the indicator, customers receive a free MFI and RSI divergence indicator, providing them with an enriched trading experience and strategy development toolkit.
In summary, the Scanner and Dashboard for MFI MT4 offers traders a robust and adaptable toolset, enhancing their ability to recognize market dynamics through price and volume analysis. This functionality, combined with comprehensive alerts and customizable settings, makes it an essential asset for both novice and experienced traders.
![]()
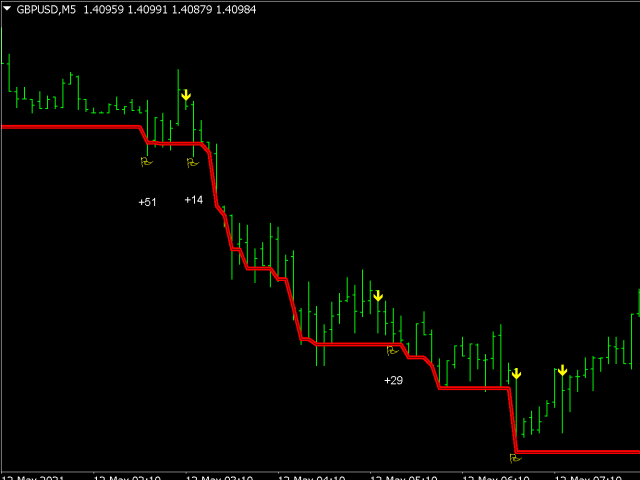
Chinetti pip collector XL MT4
Original price was: $69.$29Current price is: $29.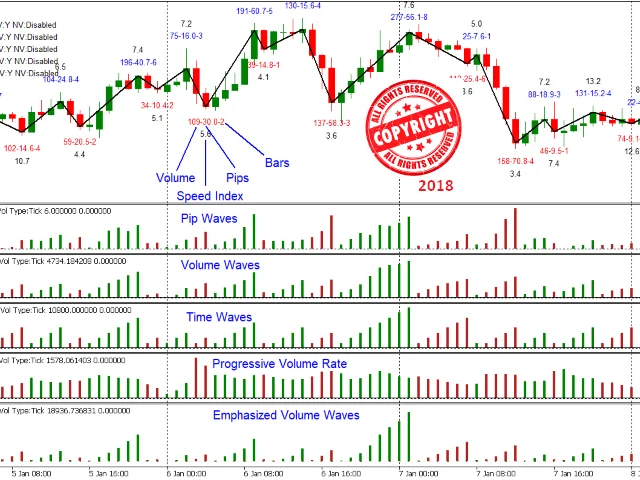
Weis Wave with Alert MT4
Original price was: $359.$29Current price is: $29.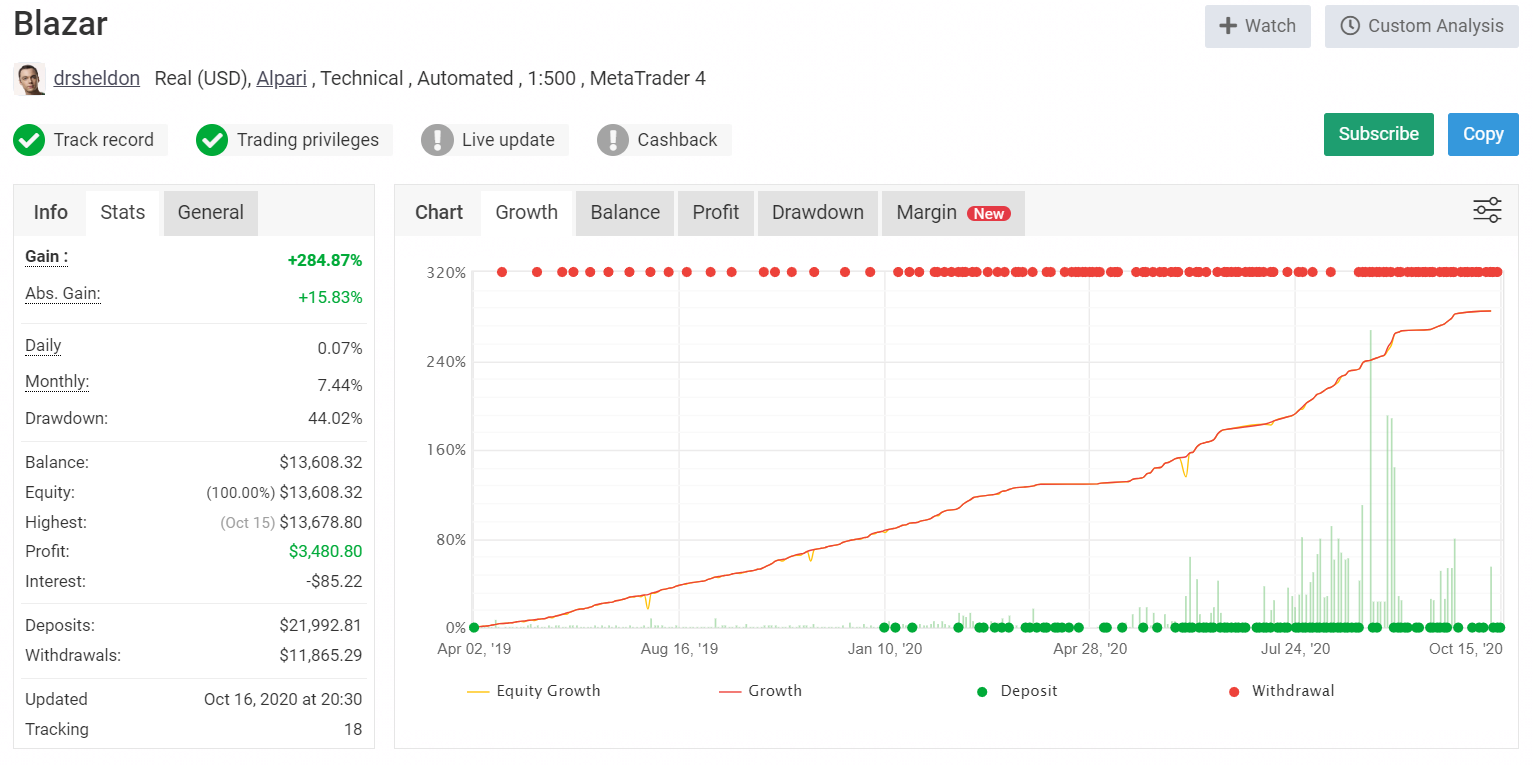
Blazar EA MT4
Original price was: $349.$29Current price is: $29.
Advanced Scalper EA MT4
Original price was: $499.$29Current price is: $29.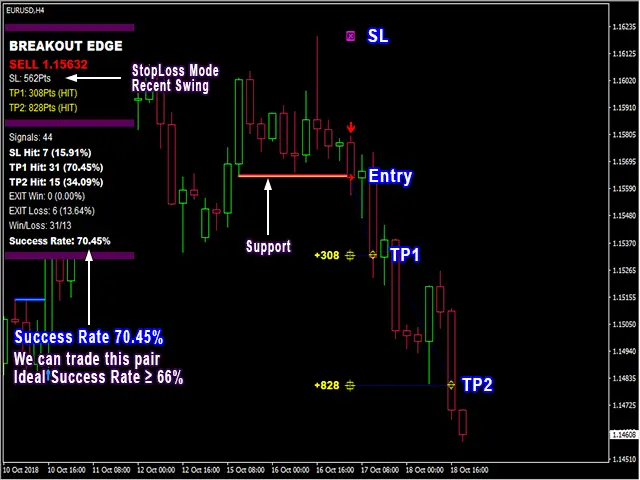
PipFinite Breakout EDGE MT4
Original price was: $98.$29Current price is: $29.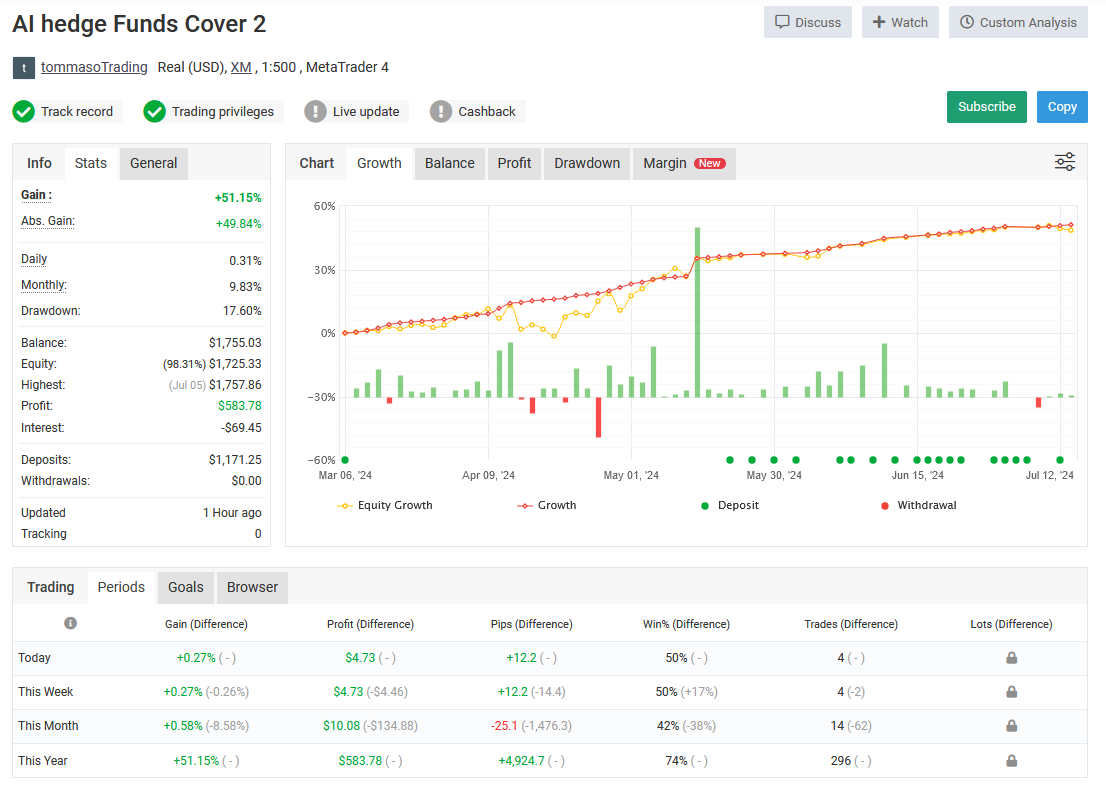
AI Hedge Funds EA MT4
Original price was: $150.$29Current price is: $29.
Dark Algo EA MT4
Original price was: $399.$29Current price is: $29.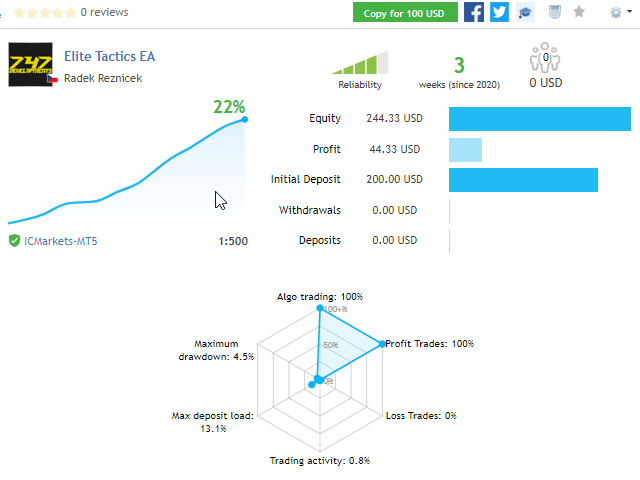
Elite Tactics EA MT4
Original price was: $245.$29Current price is: $29.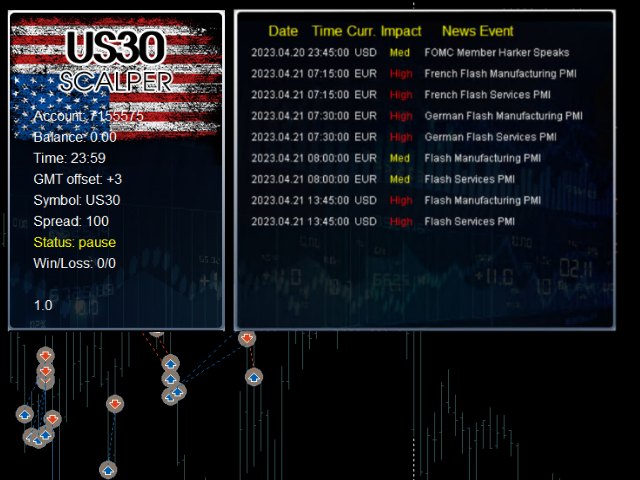
Wall Street Scalper EA MT4
Original price was: $299.$29Current price is: $29.
BiC EA MT4
Original price was: $389.$29Current price is: $29.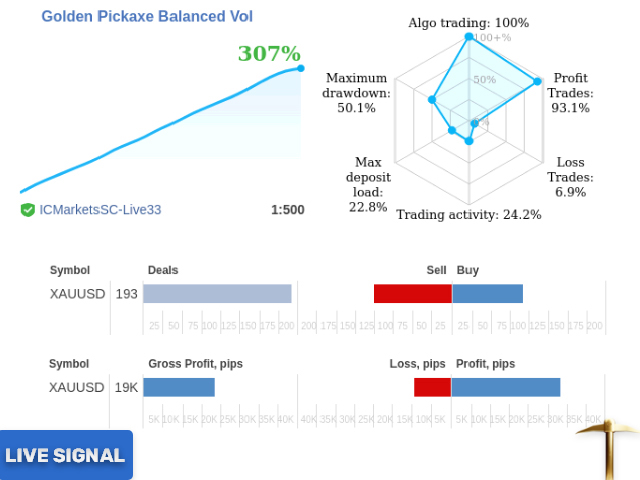
Golden Pickaxe EA MT4
Original price was: $2,400.$29Current price is: $29.
HFT Prop Firm EA MT4
Original price was: $200.$29Current price is: $29.Original price was: $30.$29Current price is: $29.
Reviews
There are no reviews yet.